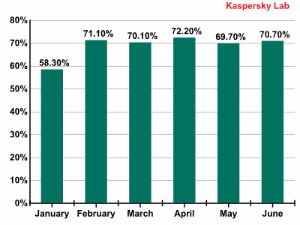
The percentage of spam in email traffic
This Quarterly Spam Statistics Report, provides the latest analysis of spam trends, malicious attachments, phishing, and insights from the Kaspersky Lab intelligence team for the 2nd quarter 2013. This report provides not only key findings and trends but also spammer methods and tricks as well as spam by source globally.
Key Findings
In Q2 the percentage of spam in total email traffic increased by 4.2% from the first quarter of 2013 and came to 70.7%. The percentage of phishing emails in global mail traffic fell by 0.0016% and came to 0.0024%. Malicious attachments were detected in 2.3% of all emails — that’s 1% less than in Q1 2013. These figures are among the results of Kaspersky Lab’s email traffic analysis for Q2 2013.
Spam Trends in Q2 2013
Many emails with malicious attachments were addressed to corporate users this past quarter. These emails were disguised as auto-replies, i.e., delivery failure notifications, or notifications of the arrival of an email, fax, or scan. Malicious users expect corporate employees to skim over the details, assume the email is legitimate and open the attachment — releasing a malicious program.
One unusual feature in Q2 was the distribution of eCards with malicious attachments. In the past these were a common sight at every major holiday, but lately malicious eCard sightings have been few and far between. However, this past quarter, Kaspersky Lab again detected these malicious mailings, this time targeting the prominent American greeting card company Hallmark.
Malicious eCards weren’t the only long-forgotten tactics detected by Kaspersky Lab in this period. In Q1 2013, one of the tricks used by spammers was “white text,” which is essentially random text added to the bottom of an email. Readers do not notice this because the color of the text is the same as the background color. The idea is to persuade spam filters that the unwanted message is a newsletter. This quarter, spammers used more or less the same trick; they added random text, but this time they didn’t even bother to make it “invisible”. Instead it was merely separated from the main body of text with a large number of empty lines. All of the texts were taken from various news stories. For example, while an email might start out with a colorful photograph advertising a certain product or service, if the recipient scrolled all the way to the bottom, he would find an small-print excerpt from a news story on Hugo Chavez, the Boston Marathon, or the conflict in Korea.
Spammer Methods and Tricks
Different types of spam generate different amounts of revenue for spammers. Your typical advertising mailing for a small business will bring in a certain amount of money, while advertisements for Viagra, for which the spammer earns a commission for each client who clicked on the link in the email and made a purchase, is paid at a different rate. However, the biggest profits are generated from malicious spam. An infected computer is worth considerably more than a Viagra purchase. Spammers are particularly interested in making sure that a malicious program gets onto a computer; perhaps that is why malicious spam often resorts to using a variety of tactics and social engineering.
Emails from Popular Sources
We have previously written about emails that imitate notifications from social networks, stores, airline emails, etc. There are still a lot of these emails out there. Readers may be interested to know that Walmart is now on the list of stores being impersonated by spammers in their fake notification emails.
Global Spam Statistics

The distribution of sources of spam by country, Q2 2013
Sources of Spam by Country
The countries that are the top sources of spam are the same as before, although their percentages have changed slightly: China is down by 1.2%, the US is down by 0.9%, and South Korea’s percentage is lower by 3%.
The amount of spam sent originating in Taiwan and Vietnam rose slightly (1.6% and 1.1%, respectively), which ranked in 4th and 5th places. The situation with some former Soviet republics is also interesting. In three of them — Ukraine, Kazakhstan, and Belarus — the percentage of outgoing spam surged and in the second quarter, these countries ranked 6th, 7th, and 8th places in the Top 20 sources of spam, pushing Russia down in the ratings. We also hasten to point out that not only did these three countries demonstrate an increase in outgoing spam all at the same time, but the dynamics of these upward movements were also very similar, peaking in May. This could indicate the emergence of new botnets in these countries or the infection of web hosting services from which spam is sent. Remarkably, when we look at sources of spam by region rather than by country, the geography is different altogether. In Europe, a lot of spam comes from South Korea (47.9%), and the percentage of spam sent from Korea to other regions is quite low. From China, most spam targets Asia-Pacific (64%) and the US (21.2%), while Europe and Russia see little to no spam coming from China. Most US-based spam ends up in the US (51.6%), and in Russia, spam arrives from Taiwan (12.2%), Vietnam (9.4%), and Ukraine (9%).
Sources of Spam by Region Globally

The distribution of sources of spam by region in Q2 2013
As far as the top sources of spam by region are concerned, the ratings did not experience any major changes from the first quarter, although the percentages of specific regions did change a bit. Asia’s percentage rose by 4.5%, and remains the number one regional source of spam. Eastern Europe’s percentage increased by 2.6%, primarily due to greater activity in Ukraine and Belarus. The percentage of spam originating in Western Europe was 3.7% lower, as was the percentage of spam originating in South America (-2.4%), which reached a new record low. Readers may remember that just two years ago, South America ranked second in terms of the amount of spam originating in that region. Other regions with changes are the Middle East (-0.2%), Africa (-0.6%), and Australia and Oceania (-0.04%).
The Size of Spam Emails
The majority of spam emails are still very small, weighing in at under 1Kb. The number of these smaller-sized emails increased from the first quarter by 4.8% and amounted to 73.8% of all spam mails. Incidentally, there was also a slight increase (+0.94%) in the percentage of emails weighing in at between 50 and 100 Kb. This size is used primarily in emails with attachments, including malicious attachments.
Malicious Attachments in Email
The amount of malicious attachments in the second quarter was lower than in the first by 1% and came to 2.3% of all mail traffic. The most prevalent malicious program spread by email in the second quarter this year was the same as in the first quarter: Trojan-Spy.HTML.Fraud.gen. Readers may recall that this malicious program is designed to look like an html page used as a registration form for online banking services. It is used by phishers to steal users’ financial information.
Phishing

The distribution of the Top 100 organization most frequently targeted by phishers,* by category — Q2 2013
* This rating is based on Kaspersky Lab's anti-phishing component detections, which are activated every time a user attempts to click on a phishing link, regardless of whether the link is in a spam email or on a web page.
The general distribution of organizations targeted by phishers did not undergo many changes from the first quarter. The number of attacks launched against social networks fell by 3.3%, and the percentage of attacks against financial organizations increased by 1.2%, pushing that category into second place in the ratings.
The percentage of attacks targeting Internet providers was up by 1.8%, and attacks against email providers rose by 2%. Readers might note that the quarterly rise in phishing attacks launched against email services is related to the sharp rise in the number of attacks that were launched in June, which amounted to 13.2%. The percentage of attacks targeting other organizations varied by less than 1%.
More and more often these days, phishers are wary of relying solely on the human factor and are less willing to wait for users to enter their own data. Instead, malicious users are now sending out malicious emails seeded with Trojans that steal usernames and passwords, including for online banking accounts.
Conclusion
Since February 2013, the percentage of spam in email traffic has seen little to no change. This is the first period in which Kaspersky Lab has observed some stabilization in spam traffic, as there have been many sharp fluctuations in spam numbers over the past few years. Kaspersky Lab expects that the percentage of spam will remain at this level in the future.
Some changes did take place in the rankings of countries where spam originates. The percentage of spam sent from Ukraine, Belarus, and Kazakhstan rose substantially. This surge points to new botnets or infected web hosting services within these countries — and we are seeing more and more spam being sent from hosting services lately.
Among the threats that are spread by email, the most prevalent families are those designed to steal data to access user accounts (usernames and passwords), particularly for online banking services. The number of emails with malicious attachments addressed to users in Russia also increased considerably.
Recently, spammers have begun sending out emails with malicious attachments designed to look like automatic delivery failure notifications sent out by servers. Another common trick is to make malicious emails look like notifications from well-known online resources, and include links to malicious websites. Kaspersky Lab recommends that users continue to exercise caution — even when dealing with emails that appear to be legitimate.